
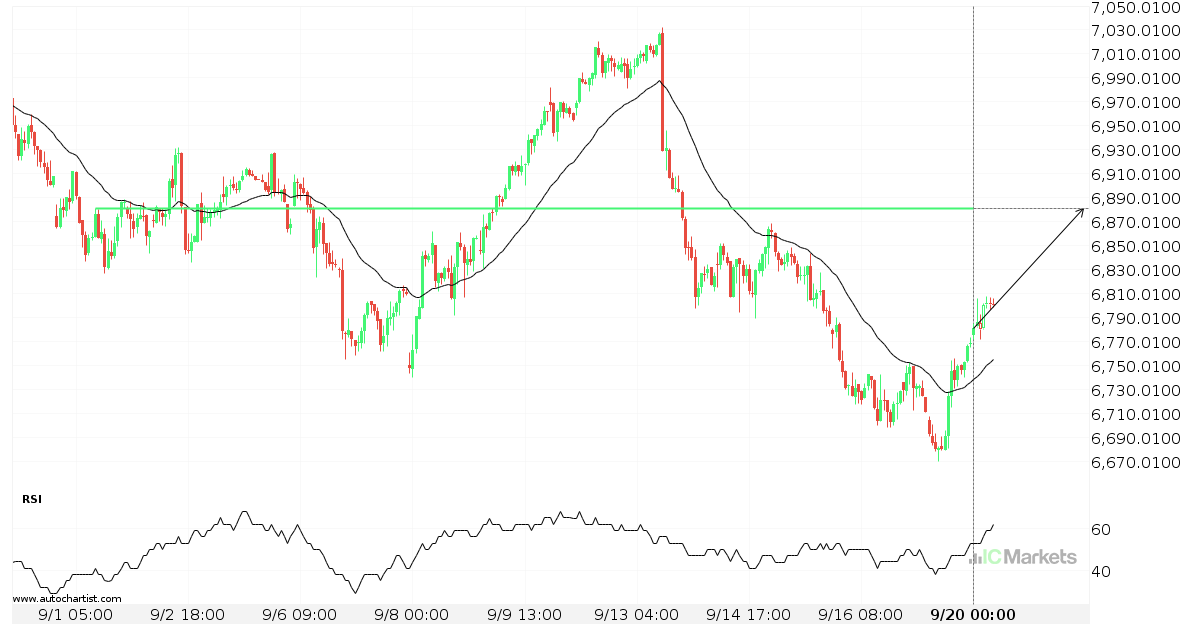
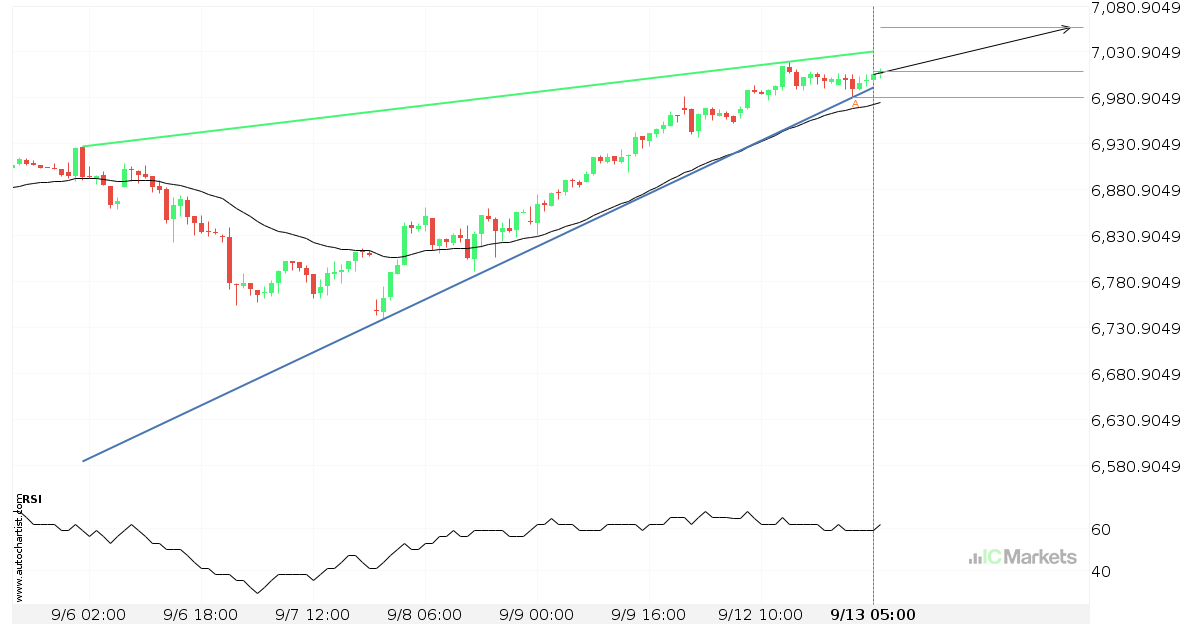
Australia 200 Index approaching important 6881.3799 price line
Australia 200 Index is moving towards a resistance line. Because we have seen it retrace from this level in the past, we could see either a break through this line, or a rebound back to current levels. It has touched this line numerous times in the last 19 days and may test it again within […]
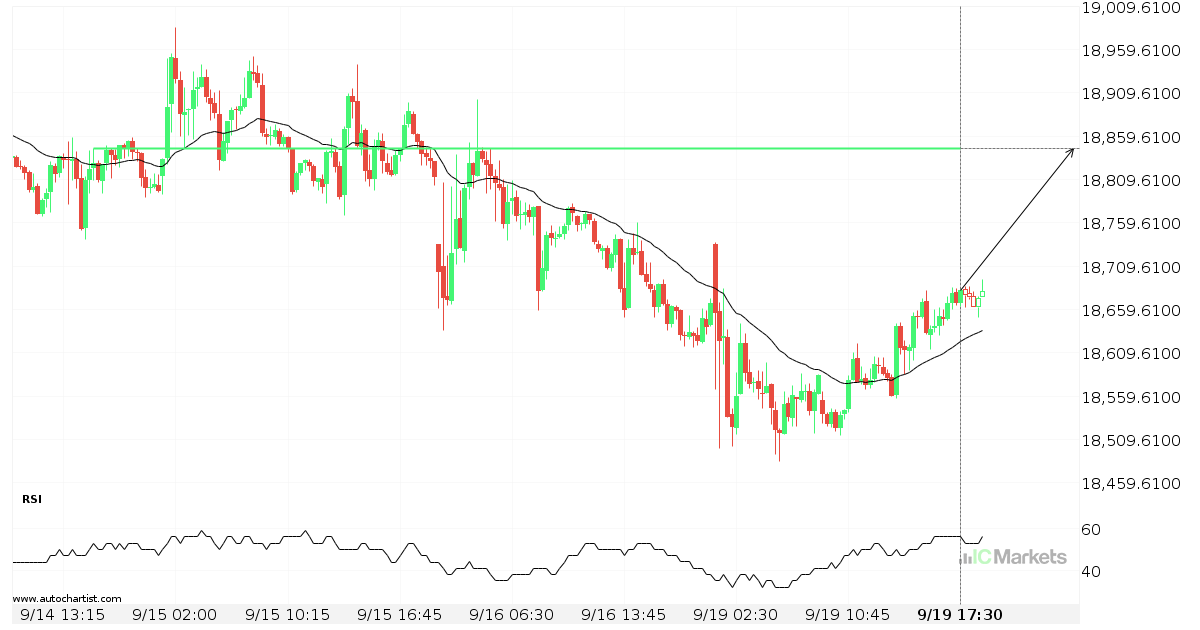
Hong Kong 50 Index approaching important 18844.8008 price line
Hong Kong 50 Index is moving towards a resistance line. Because we have seen it retrace from this level in the past, we could see either a break through this line, or a rebound back to current levels. It has touched this line numerous times in the last 6 days and may test it again […]
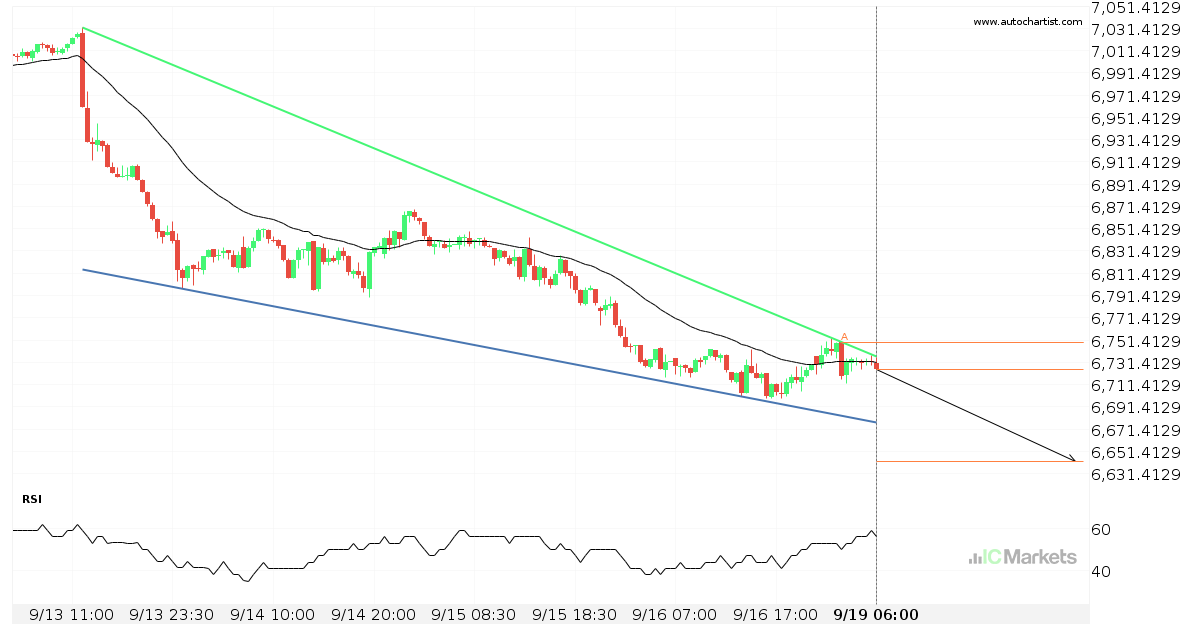
Australia 200 Index approaching support of a Falling Wedge
Australia 200 Index is approaching the support line of a Falling Wedge. It has touched this line numerous times in the last 6 days. If it tests this line again, it should do so in the next 2 days.
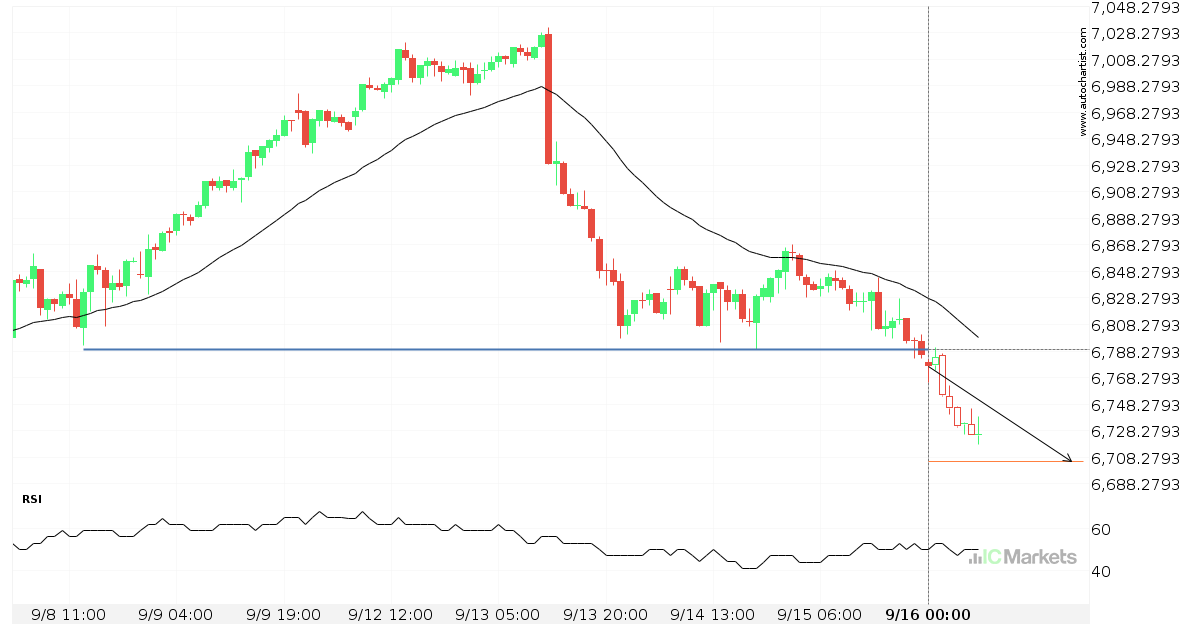
Possible start of a bearish trend on Australia 200 Index
Australia 200 Index has broken through a line of 6789.6899. If this breakout holds true, we could see the price of Australia 200 Index heading towards 6705.1548 within the next 23 hours. But don’t be so quick to trade, it has tested this line numerous times in the past, so you should probably confirmation the […]
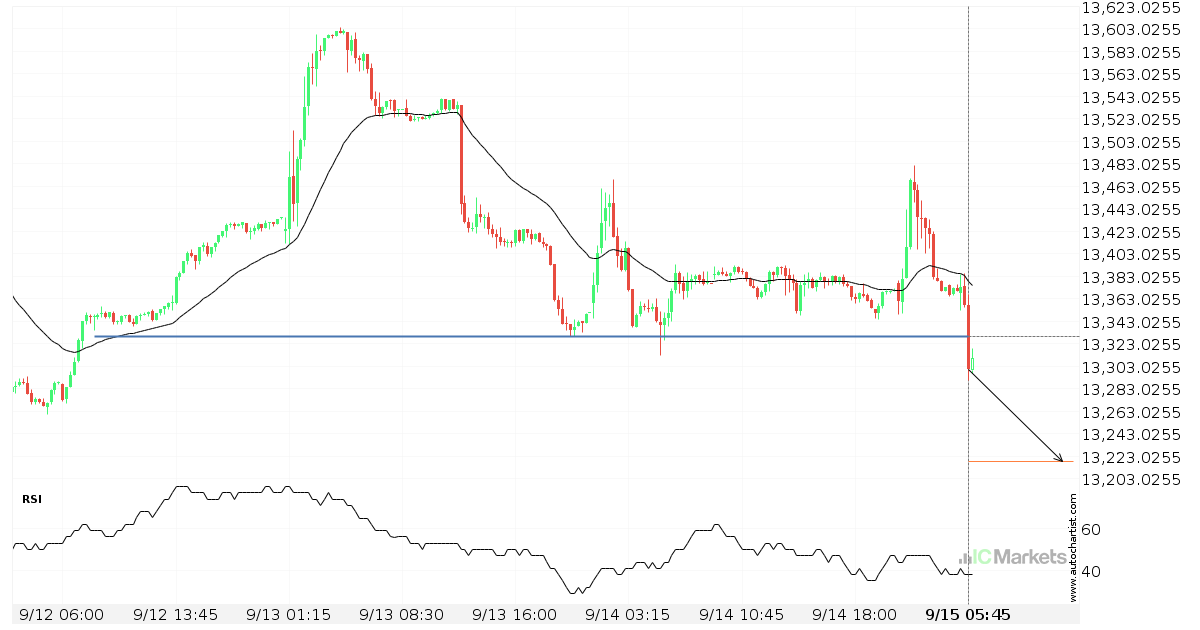
FTSE China A50 Index broke through important 13328.9600 price line
FTSE China A50 Index has broken through a support line. It has touched this line numerous times in the last 3 days. This breakout shows a potential move to 13218.4502 within the next 14 hours. Because we have seen it retrace from this level in the past, one should wait for confirmation of the breakout.
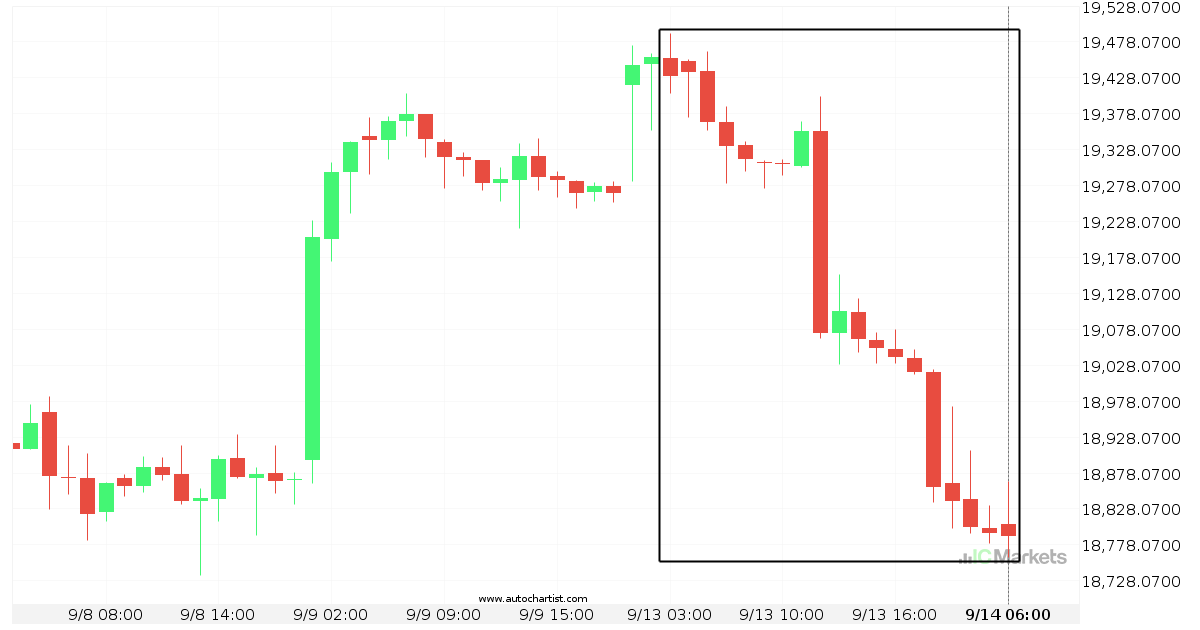
Hong Kong 50 Index is on its way down
Hong Kong 50 Index has experienced an exceptionally large movement lower by 3.26% from 19454.8 to 18790.3 in the last 2 days.
Possible breach of resistance level by Australia 200 Index
Australia 200 Index is moving towards a resistance line which it has tested numerous times in the past. We have seen it retrace from this line before, so at this stage it isn’t clear whether it will breach this line or rebound as it did before. If Australia 200 Index continues in its current trajectory, […]
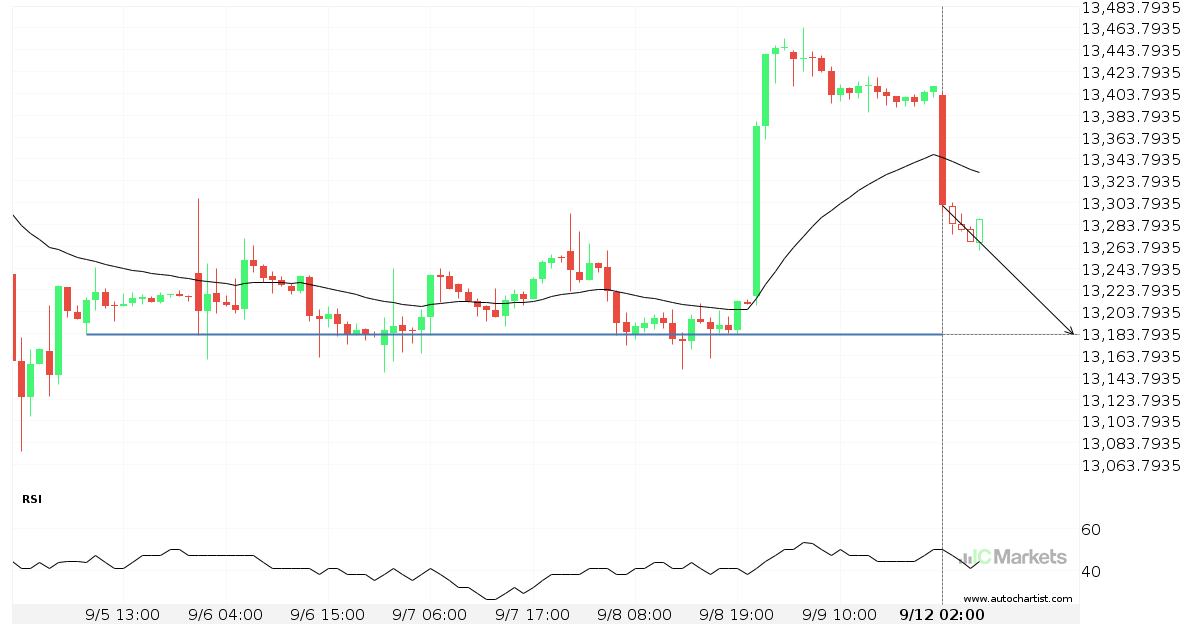
Breach of important price line imminent by FTSE China A50 Index
FTSE China A50 Index is moving towards a line of 13182.8701 which it has tested numerous times in the past. We have seen it retrace from this position in the past, so at this stage it isn’t clear whether it will breach this price or rebound as it did before. If FTSE China A50 Index […]
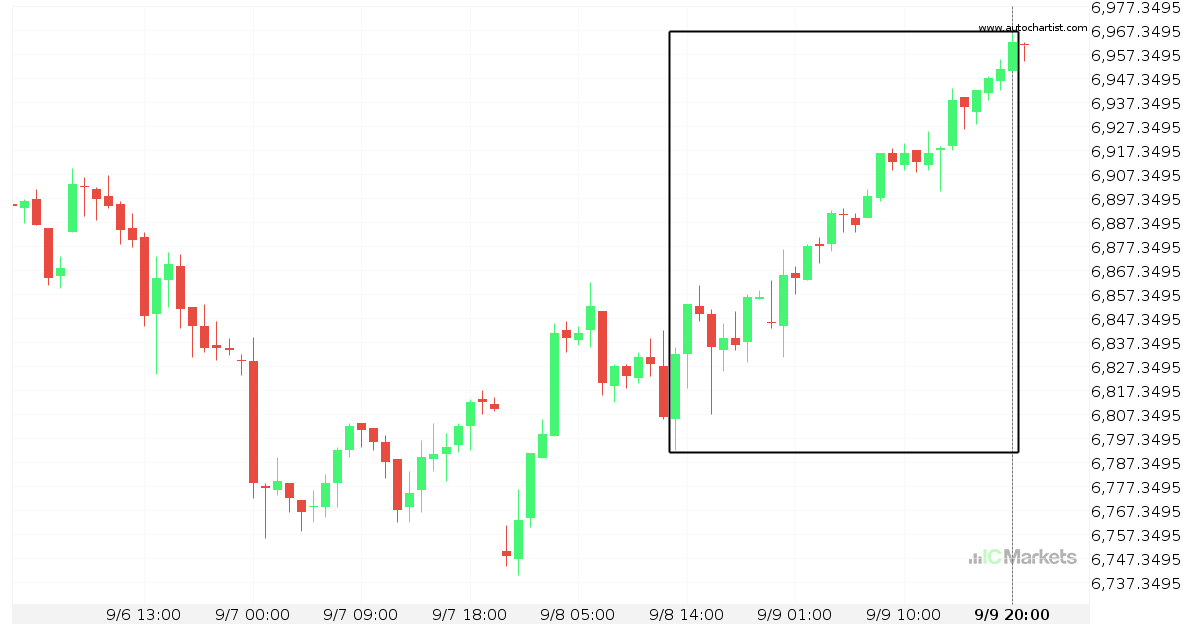
Australia 200 Index experienced an exceptionally large movement
For those of you that don’t believe in trends, this may be an opportunity to take advantage of an exceptional 1.9% move on Australia 200 Index. The movement has happened over the last 2 days. For those trend followers among you, you may think about riding this possible trend.
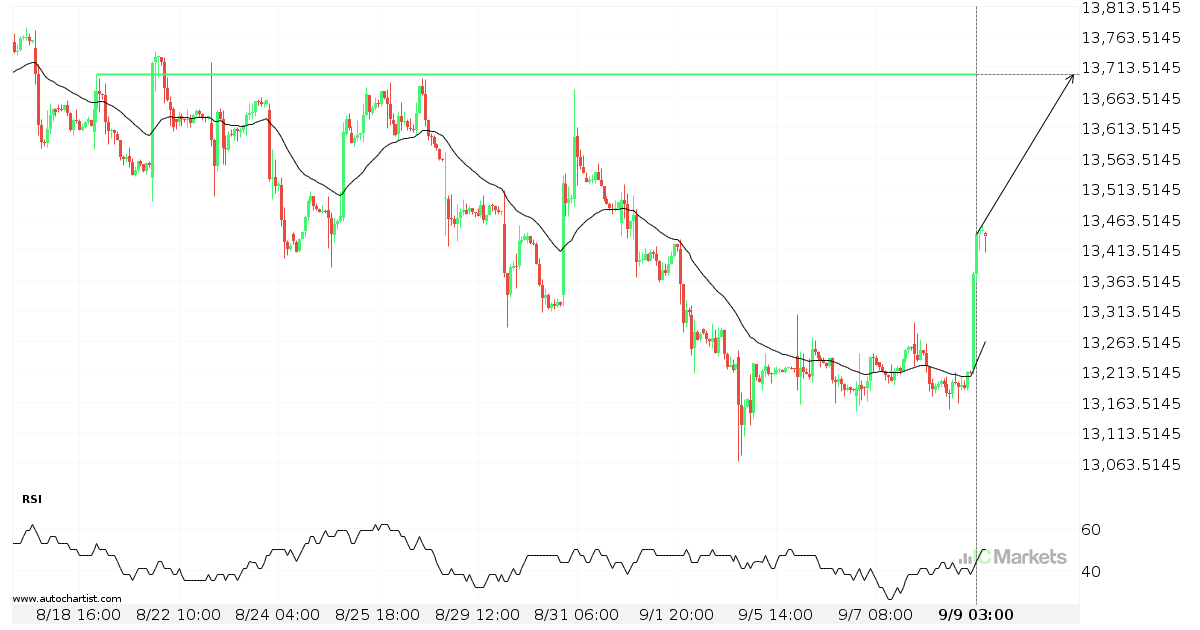
Breach of important price line imminent by FTSE China A50 Index
FTSE China A50 Index is moving towards a line of 13700.9697 which it has tested numerous times in the past. We have seen it retrace from this position in the past, so at this stage it isn’t clear whether it will breach this price or rebound as it did before. If FTSE China A50 Index […]